ABC’s of Splunk Part Seven: Basics of Search

Now that you have some knowledge from our previous blogs, you are now ready to start your journey to become a Splunk Ninja!

For the next six blogs, we are going to focus on Search starting from the basics and moving into advanced correlation and detection. Let’s begin…

Splunk uses Search Processing Language, commonly known as SPL. Which is very similar to SQL or Database query language and your ability as a Splunk administrator to conduct complex searches allows you to extract the maximum value out of your Splunk investment

Prerequisites

Since every installation is different based on the environment that it’s collecting data from, I’m opting to create a standard template for the data acquisition so that the reader can walk through this blog with as little confusion as possible.  Please feel free to experiment with your actual data as you see fit and if something doesn’t work, ping me and I should be able to respond to you within 24 hours.


Splunk Installation – You must have Splunk Enterprise installed in your environment. Follow the Splunk Installation Blog to install Splunk Enterprise. 

Data Onboarding – For this blog, we’ll be using data from the top command 


Follow below steps to collect the data. This will help you follow the blog along and perform the searches on your own.

1. Open Splunk Web UI.

2. Install Unix and Linux Add-on for Splunk.

    • Go to Manage Apps. (Settings button on Splunk Home page)
    • Click on Browse more Apps.
    • Search for ”Unix and Linux“
    • Click on Install, on the “Splunk Add-on for Unix and Linux”.

3. Enable the input to collect the data.

    • Once the Add-on is installed, click on Open App.
    • Click on Continue to app setup page.
    • You will see a page like this.
    • Find for “top” on the page and Enable the Input.
    • Click on Save.

4. Change the index to os. 

    • Login (ssh) to the backend of the Splunk machine.

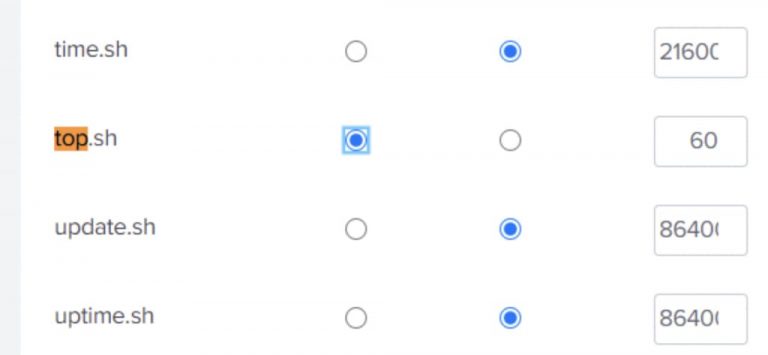
    • Open inputs.conf in the editor.
    • Search for top.

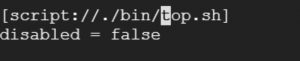
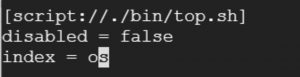
    • Add the below line in the stanza.

      • index = os

    • Your final stanza would look like:

    • Save the file.

    • Restart Splunk.

Let’s Start Splunking

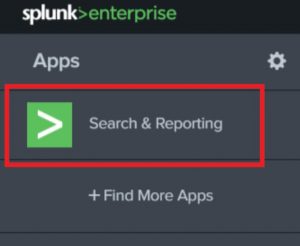
Login to Splunk Web UI.

You will see a list of App on the left sidebar when you login. Open the Search & Reporting App.

Let’s understand the main search part.


Search Bar – Where you will be writing SPL queries.

Time Range Picker – Each event (log) in Splunk has a timestamp, you can limit the time of your search with timerange picker.

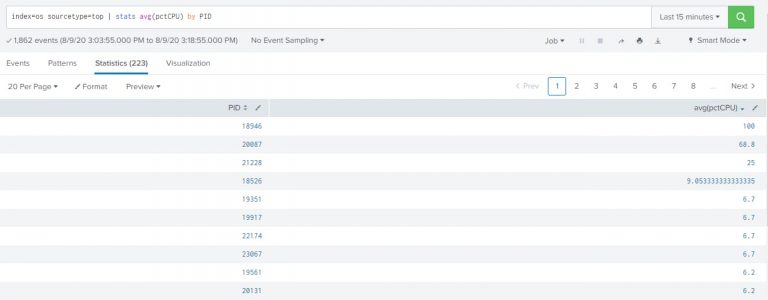
Add below search in the search bar and hit enter.

index=os

Controls – Gives the option to choose “how to show the search results.”

  • Events – Shows Events

  • Statistics – Shows results in a table(statistics) format. (We’ll get more idea later in this blog)

  • Visualization – Shows results in charts (visualization). (We’ll get more idea later in this blog)

Events Tab

Fields – Show fields present in all the events as part of the results of your search.

Event – one of the events of the results. An Event is a log collected earlier in the Splunk as part of the data onboarding process.

Timestamp – Timestamp of an event in Splunk. It usually represents the time of an event on the source.

Commands

SPL (Search query) uses commands to format results in different formats. The purpose of a command could be to format the result, to evaluate some value based on other values, to summarize the results or anything else. 

We’ll learn a few basic and very useful commands in this blog. Let’s understand commands by first command “table”.

Command – table and Statistics Tab

The command table is the formatting command and shows how fields should be displayed in a table format.


Notice that the results, in this case, are shown in the Statistics tab in a tabular form.

Now, let’s understand some more highly used commands.

Command – eval

To evaluate some function on any field(s)


Command – stats

To transform the results to get some useful statistics


index=os sourcetype=top | stats avg(pctCPU) by PID


This query will give average CPU usage by different processes in the system.


Command – timechart and Visualization Tab

Like stats, timechart also transforms the results in the statistics, but timechart can provides statistics with regards to time.


index=os sourcetype=top PID=18264 | timechart span=5m avg(pctCPU)


This query also give average CPU usage by different processes in the system, but with timechart it shows an average CPU usage per 5 minutes over time.

The span parameter in the command is optional.


The results will be shown to you on the Statistics tab. Just change to Visualization tab to see a line chart like below.


Chart Type – If you don’t see a line chart and see some other chart, then you can change the chart with this option.

  • Line Chart

  • Area Chart

  • Bar Chart

  • Column Chart

  • Bubble Chart

  • Map

  • Pie Chart

  • Single Value

  • Etc.


Chart Formatter – This will provide you various options related to the selected chart type.

     For example, 

  • For the line chart, it allows selecting an option for what to choose when the value isn’t available. Like, show null or show zero or connect previous and next values with a line. (Reference)

  • For the column chart and bar chart, it allows you to choose stack mode. (Reference)

Command – where

To filter the results based on the condition. Unlike the search command, where command also allows to use >, <, signs.

index=os sourcetype=top | stats avg(pctCPU) as AvgCPU by PID | where AvgCPU>10


Command – rename

To rename the fields

index=os sourcetype=top | rename PID as ProcessID


Above command renames the “PID” field with the new name “ProcessID”

Unlike the eval command, which generates the new field.


Command – sort

To sort the results based on some field values.

index=os sourcetype=top | stats avg(pctCPU) as AvgCPU by PID | sort – AvgCPU


  • sort – <fieldname> – Indicate the descending order sorting

  • sort + <fieldname> – Indicate the ascending order sorting


Command – dedup

To get only first events based on the value of any field(s)

index=os sourcetype=top | dedup PID


You can have multiple fields with PID.  When you put multiple fields with dedup, it will keep events where there are unique combinations of these field values.

Now when you know basic search commands of Splunk, play around the search by your self. Search the other data available in your environment.

You can find all the search command available with Splunk here – http://docs.splunk.com/Documentation/Splunk/6.5.2/SearchReference/Commandsbycategory

Play around using different charts. You can get more information about each different types of the charts here – https://docs.splunk.com/Documentation/Splunk/8.0.5/Viz/Visualizationreference

Written by Usama Houlila.

Any questions, comments, or feedback are appreciated! Leave a comment or send me an email to [email protected] for any questions you might have.

Sign Up Now!

For exclusive news, information, and Events!


By submitting this form, you are consenting to receive marketing emails from: CrossRealms International. You can revoke your consent to receive emails at any time by using the SafeUnsubscribe® link, found at the bottom of every email. Emails are serviced by Constant Contact